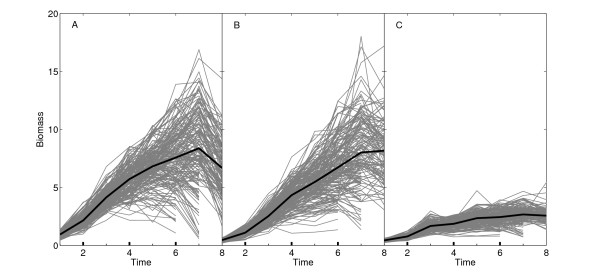
Figure 1.
Growth trajectories of leaf (A), stem (B) and root biomass (C) measured at multiple time points in a growing season of soybeans. Each grey line presents the growth trajectory of one of 184 RILs, whereas black lines are the mean growth trajectories of all RILs fitted using a system of ODEs (1).

