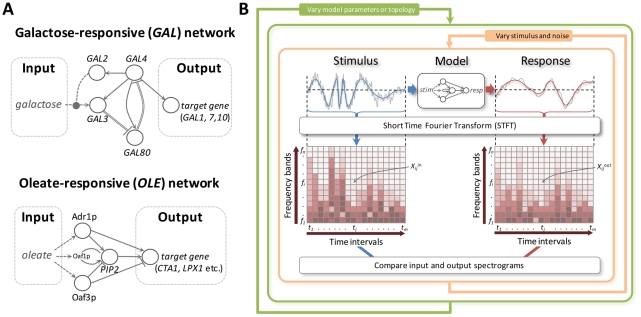
Figure 1. The generalized time-frequency analysis of the dynamical properties of molecular networks.
(A) Schematic representations of the GAL (left) and OLE (right) networks. The GAL network is comprised of dual positive and negative feedback loops in which galactose activates Gal3p relieving Gal80p repression of Gal4p activity which upregulates the expression of GAL genes [11], [12]. The OLE network is comprised of overlapping positive and negative (coherent type 1 and type 2) feed-forward loops [24] in which oleate directly and indirectly activates core transcription factors (Oaf1p, Pip2p, Adr1p and Oaf3p) which regulate combinatorially target genes, such as the transcription factor PIP2, the catalase CTA1, the peroxisomal lipase LPX1 and others [9], [10]. Networks are displayed as interactions of genes and gene products, which are not explicitly distinguished in the illustration. Solid lines terminating in arrowheads denote positive regulation whereas lines terminating in bars denote repression. Single solid lines represent protein-DNA interactions whereas double lines denote protein-protein interactions. Dotted arrows represent activation by the metabolite. The dotted oval arrow denotes activation of galactose transport. (B) Workflow of the generalized TFA. Noisy, time varying stimuli are used as inputs to a model of the network and the response is determined. Input and output signals are transformed into component frequencies by the STFT. The contribution of each frequency band (fi) at time interval (tj) is a spectrogram coefficient (Xij) and is represented in the spectrogram by a color intensity. Stimuli are varied randomly in the context of systematically varying model topologies and parameters.

