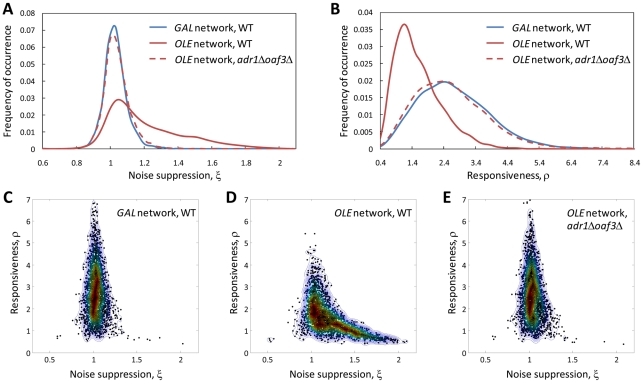
Figure 2. Feed-forward loops of the OLE network endow the system with ability to filter high-frequency fluctuations of the stimulus whereas feedback loops of the GAL network confer responsiveness to the environmental changes.
(A, B) Distribution of the noise suppression and responsiveness statistics for GAL (WT) and OLE (WT or adr1Δoaf3Δ) networks, respectively. (C–E) Responsiveness/noise suppression plots for GAL (WT) and OLE (WT, adr1Δoaf3Δ) networks, respectively. The ξ and ρ were calculated based on 3000 random time-varying stimuli and system responses (see also Figures S3, S4, S5, S6 and S7). The contour plots were constructed using a bivariate Gaussian kernel density estimator (see Text S1). Noise suppression values less than 1 indicate the system responses to these stimuli contain higher harmonics than the input signals and vice versa. Low responsiveness values indicate poorly matched input and output signals. Δ denotes lack of a corresponding gene.

