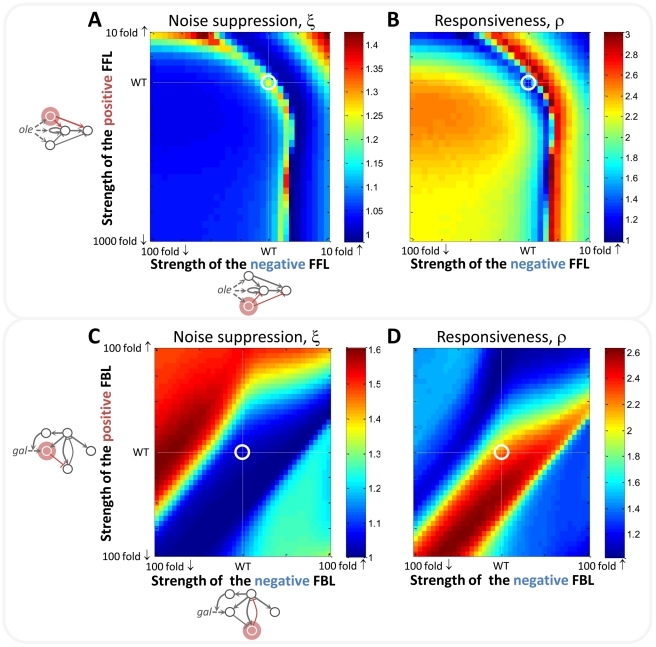
Figure 3. The noise suppression (ξ) and the responsiveness (ρ) of the networks are sensitive to both to the topologies and rate parameters.
(A, B) The ξ and ρ, respectively, of the OLE network as a function of the strengths of positive and negative FFLs. (C, D) The ξ and ρ, respectively, of the GAL network as a function of the strengths of positive and negative FBLs. Each point on the heat maps represents the averaged ξ and ρ, respectively, over 100 random and noisy stimuli (see also Figures S11 and S12). The strengths of the FFLs/FBLs are on a logarithmic scale. White lines represent WT parameters and their encircled intersection is the WT network.

