Figure 7.
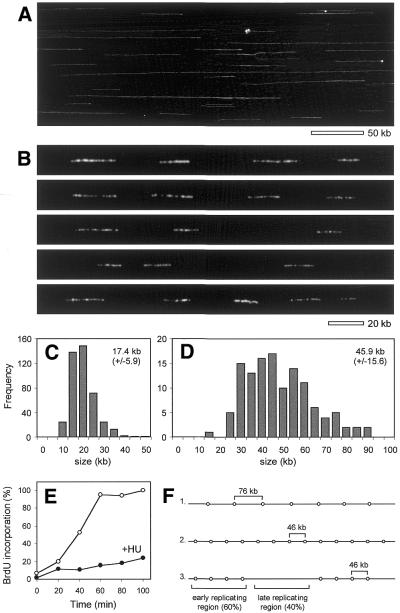
Analysis by DNA combing of replicon size and distribution in HU-arrested cells. (A) TK+ yeast cells (E1000) were arrested in G1 with α-factor and released in medium containing 0.4 mg/ml BrdU and 0.2 M HU for 90 min. Cells were embedded and lysed in agarose plugs to preserve DNA integrity. Plugs were digested with agarase and chromosomal DNA was stained with YOYO-1, combed on silanized coverslips and observed by microscopy as described in Materials and Methods. (B) Detection of BrdU-substituted regions on combed chromosomes using anti-BrdU (DAKO) and Alexa 488 antibodies. The bar (20 kb) was derived from size measurements of DNAs of known length. (C) Size distribution (in kb) of the BrdU signals. (D) Histogram of distances between the centers of adjacent BrdU-labeled regions. (E) Quantification of the overall BrdU incorporation in HU-arrested cells. E1000 cells were released from α-factor arrest in the presence (filled circles) or absence (open circles) of HU. For each time point the relative amount of incorporated BrdU was determined and normalized to genomic DNA as described in Materials and Methods. HU-arrested cells incorporate 23% of the BrdU incorporated during a complete round of DNA replication. (F) Model for the distribution of active origins in HU-arrested cells. Average IOD derived from total BrdU incorporation (model 1), replicon size measurements (model 2) and a model reconciling both types of calculation (model 3) (see text for details).

