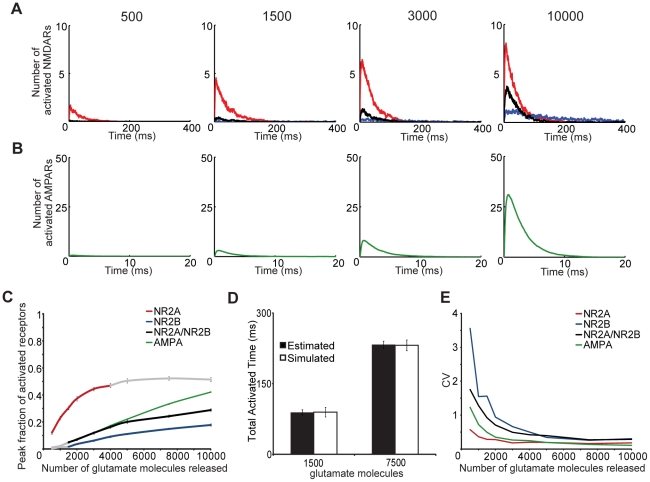
Figure 3. Dynamic range of NMDAR subtype and the scalability to a physiological synapse.
Activation or opening of each receptor subtype was observed in response to varied levels of glutamate release (500–10,000 molecules, number denoted above graphs in A). Number of activated (A) NMDA receptors over time is shown for NR2A (red), NR2B (blue), and NR2A/NR2B (black) and (B) AMPA receptors in response to 500, 1,500, 3,000, and 10,000 molecules. (C) NR2A-NMDARs show a significantly higher fraction activation compared to the other subtypes. NR2A-NMDAR activation increases (p<0.05) over the physiological range of univesicular glutamate release (500–1,500 molecules), but saturates at larger glutamate levels (shaded in gray), while activation of NR2B-containing NMDARs significantly increases only in the range of multivesicular glutamate release (2,000–10,000) (p<0.05). Colored segments represent regimes of increased activation compared to preceding release amount (p<0.05). Peak percent of AMPARs significantly increases over the entire range of modeled glutamate release (p<0.05). (D) Average response of an individual receptor for each subtype can be used to estimate the total synaptic response of a mixed population of receptor subtypes (8 NR2A, 8 NR2A/NR2B, and 4 NR2B) that is not different from responses observed when the activation of this mixed population is indeed simulated. (n = 40 simulations per condition) (E) The stochastic variation in response, reflected in the coefficient of variance calculated for receptor opening, is greatest for NR2B-containing NMDARs at low levels of glutamate release, but variation is decreased for each glutamate receptor subtype at large numbers of released glutamate.

