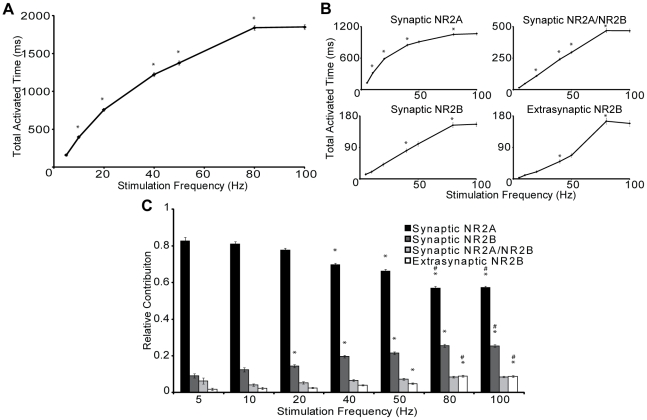
Figure 5. Frequency mediated shifts in NMDAR subtype activation patterns.
The dendritic spine model (80 AMPARs, 8 NR1/NR2A NMDARs, 4 NR1/NR2B NMDARs, 4 NR1/NR2A/NR2B, and 10 extrasynaptic NR1/NR2B NMDARs) was subjected to presynaptic stimulation of various frequencies (5 Hz–100 Hz), and the stochastic release of glutamate vesicles was simulated using an approach developed for hippocampal synapses [Kandaswamy et al, 2010]. Total activated time increases for (A) all NMDARs and (B) for each NMDAR subtype individually as the stimulation frequency is increased (* p<0.05 significant increase from previous frequency). (C) Relative contribution for each subtype to the total receptor open time shows the changing patterns of NMDAR subtype activation during frequency stimulation, with NR2A-NMDAR contributing less and NR2B containing NMDARs contributing more at high frequency stimulations. (* p<0.05 compared to contribution at 5 Hz, # p<0.05 compared to 50 Hz) (n = 100 simulations per condition).

