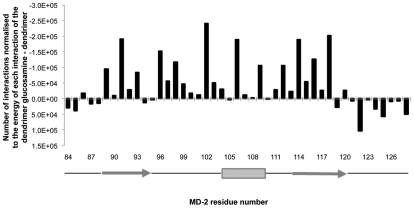
Figure 4. Number of interactions between human MD-2 and ligands normalised to the energy values for each interaction.
The graph shows the difference between the number of interactions with human MD-2 of the unmodified dendrimer and the partially glycosylated dendrimer from the docking study performed with Hex after it was normalised for the energy value for each interaction. The graph also shows the residues that line the opening of human MD-2's hydrophobic pocket. The secondary structure of human MD-2 is shown with the solid grey arrows representing the ß6 (Pro88 to Ile94) and ß7 strands (Val113 to Ser120). The grey box represents the α-helix (Phe104 to Lys109). The lines represent the loops.

