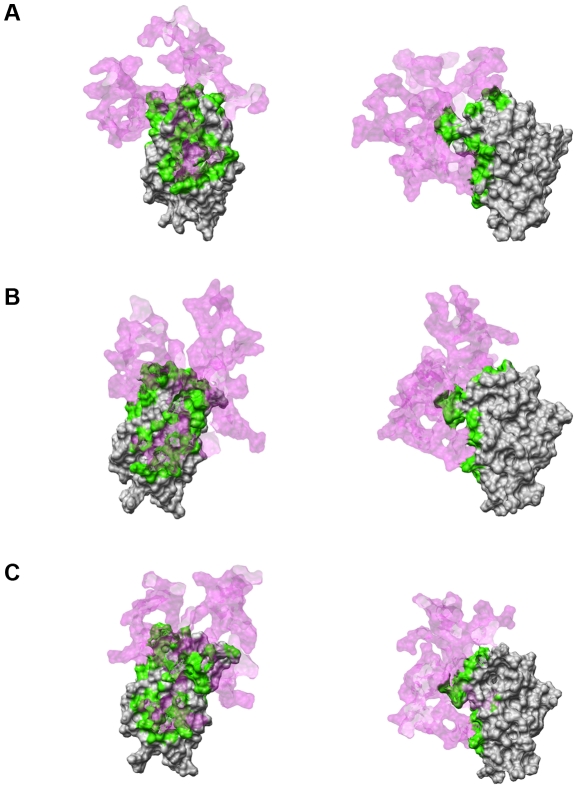
Figure 7. Surface contact area between human MD-2 and the partially glycosylated dendrimer.
(A) 0 ns, (B) 1.6 ns, (C) 2.4 ns. Left – frontal view of human MD-2. Right – side view of human MD-2. The human MD-2 surface is shown in grey, the partially glycosylated dendrimer's surface is shown in pink with 80% transparency, and their contact surface area is shown in green.

