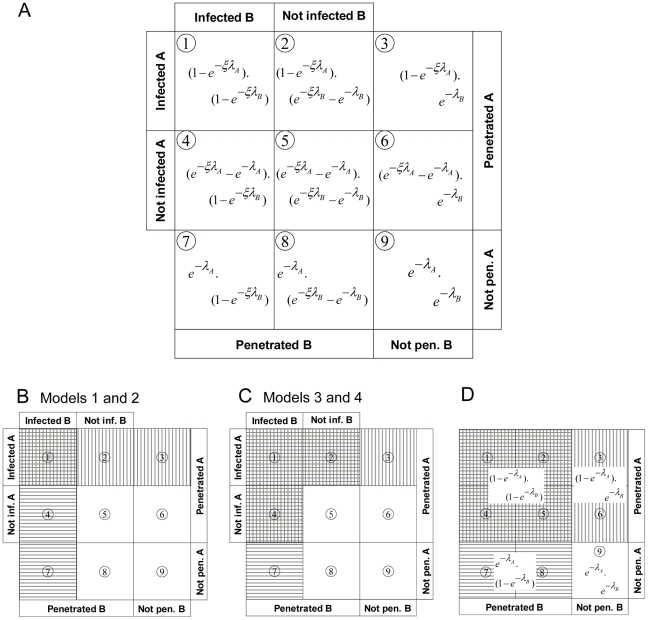
Figure 2. A diagrammatic representation of models presented in this paper.
Diagram summarizing the expected proportions of hosts penetrated (or not) by genotypes A and/or B, and infected (or not) by genotypes A and/or B of a micro-parasite. The diagram is conditional on realizations of ξ, λ
A and λ
B. In a real population of insects, there will be heterogeneity in these parameters, which will distort the proportionalities in the figure. Hence, the panel illustrates only the aspect of dependence, given penetration and infection chances, and it does not represent the effects of heterogeneity. Panel A gives an overview of the all possible outcomes – in terms of penetration and infection – after challenge of hosts with virions of genotypes A and B. Hosts can be penetrated or not, and if hosts have been penetrated, they can be infected. These outcomes hold for all four models presented here. Panel B corresponds to Models 1 and 2, where only infecting genotypes are genetically represented in the viral progeny. The expected fractions of alive larvae (no fill), penetrated by virions of genotype A only or penetrated by both genotypes and infected by A (vertically dashed), penetrated by genotype B only or penetrated by both genotypes and infected by B (horizontally dashed), and penetrated by both genotypes and infected by both genotypes (horizontally and vertically dashed) are illustrated. Panel C corresponds to Models 3 and 4, where all penetrating genotypes are genetically represented in the viral progeny, conditional upon the host being infected by (at least) one virion. The expected fractions of alive larvae (no fill), penetrated by genotype A only and infected by A (vertically dashed), penetrated by genotype B only and infected by B (horizontally dashed), and penetrated and infected by both genotypes or penetrated by both genotypes and infected by genotype A or penetrated by both genotypes and infected by genotype B (horizontally and vertically dashed). Note that In Models 1 and 2 (Panel B) the fraction of non-infected hosts conditional upon ξ is greater than the fraction non-penetrated, whereas in Models 3 and 4 (Panel C) that fraction exactly equals the fraction non-penetrated. Panel D represents the original, single-phase IAH model, where penetration of the host automatically leads to infection. The equations indicate the cumulative probabilities underlying boxes (e.g.,  is the sum of boxes 1,2,4 and 5).

