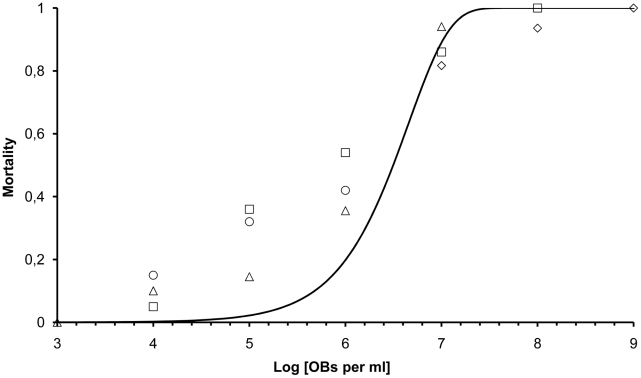
Figure 3. Dose response for AcMNPV infection of S. exigua L5.
On the x-axis is the log10 of the virus dose (OBs per ml) droplet fed to larvae. The proportion of hosts dying is on the y-axis. The different symbols represent different replicates, which covered different ranges in dose. The line represents the IAH dose response relationship by non-linear regression (mortality = 1 - exp(-p· OB concentration), SPSS 15.0), rendering p = 2.205×10⁻⁷.

