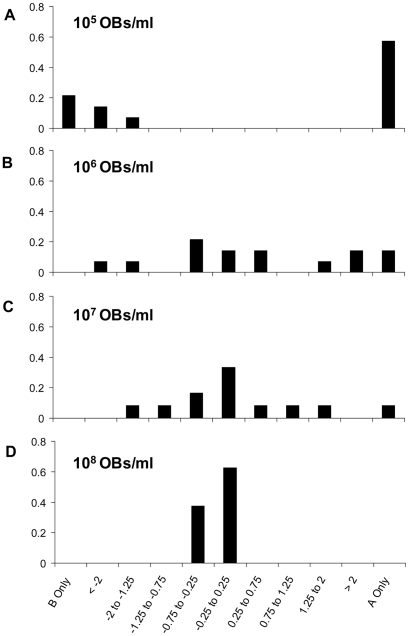
Figure 4. Ratio of genotype A to genotype B in infected hosts.
The log-transformed genotype ratio (A:B) is given for S. exigua L5 larvae at different inoculum OB concentrations, as indicated in the upper left-hand corner of each panel. On the x-axis is the log10 of the genotype ratio (A:B), and on the y-axis frequency. Host survival (S) decreased with inoculum OB concentration, from S = 0.72 (105 OBs per ml) to S = 0.03 (108 OBs per ml). The number of hosts per dose are 14 (105 and 106 OBs per ml), 12 (107 OBs per ml) and 8 (108 OBs per ml).

