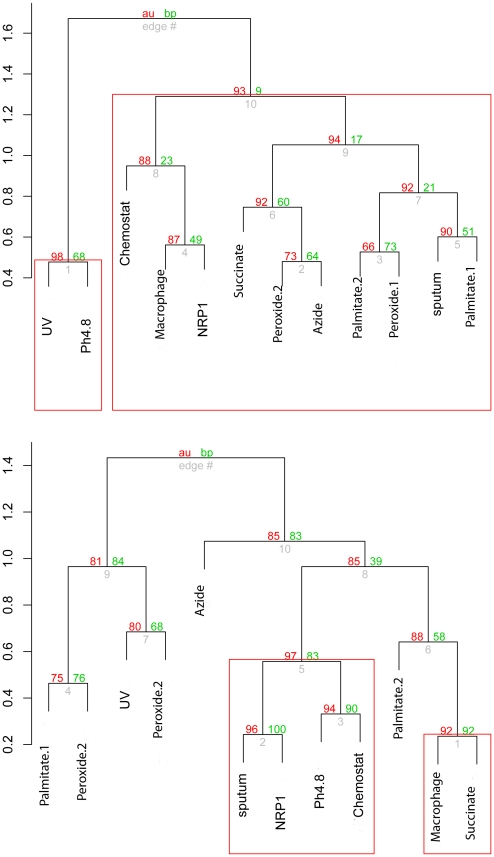
Figure 3. Clustering of M. tuberculosis gene expression datasets.
Clustering of gene expression datasets based on DPA of metabolites associated with up-regulated genes, A) and down-regulated genes, B). Red numbers indicate the Approximately Unbiased (au) multiscale bootstrap based p-value for dendrogram. We used 90% confidence to identify significant clusters (with Red bounding boxes).

