Fig. 4.
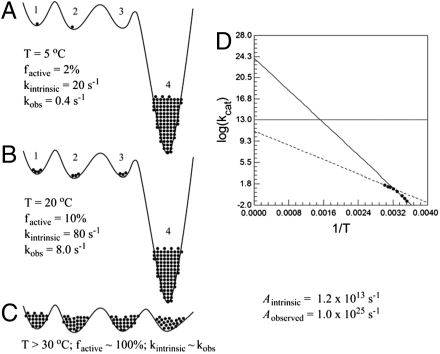
Simulation of conformational sampling that leads to elevated values of Aobs. The conformational landscape of the enzyme is represented by a solid black line in panels A–C, with energy increasing along the vertical axis. Four states (i = 1–4) available to the enzyme are numbered, and the fraction of enzyme fi occupying each conformer is proportional to the number of black dots, with one dot = 1% of the enzyme. States 1, 2, and 3 are designated as the catalytically active region of the conformational space, and state 4 is inactive (k4 = 0 at all temperatures). (A) At 5 °C k1, k2, and k3, which represent the intrinsic rate constant for the corresponding conformers, are all set at 20 s-1. Using Eq. 2, the observed rate constant is calculated as f1 ∗ k1 + f2 ∗ k2 + f3 ∗ k3 + f4 ∗ k4 = 0.01 ∗ 20 + 0.01 ∗ 20 + 0 ∗ 20 + 0.98 ∗ 0 = 0.4 s-1. (B) At 20 °C the fractional occupation of the respective conformers has shifted, and the intrinsic rate constant for conformers 1–3 has increased. When the observed rate constant is calculated again, a value of 8.0 s-1 is obtained. (C) At temperatures above 30 °C deep local minima are avoided, as a result of a cooperative transition that eliminates the low energy trap from the conformational ensemble. The behavior represented in C is expected to be representative of native enzymes under optimal conditions. (D) An Arrhenius plot for V260A demonstrates how temperature-dependent sampling of active conformational space can greatly inflate Arrhenius parameters.

