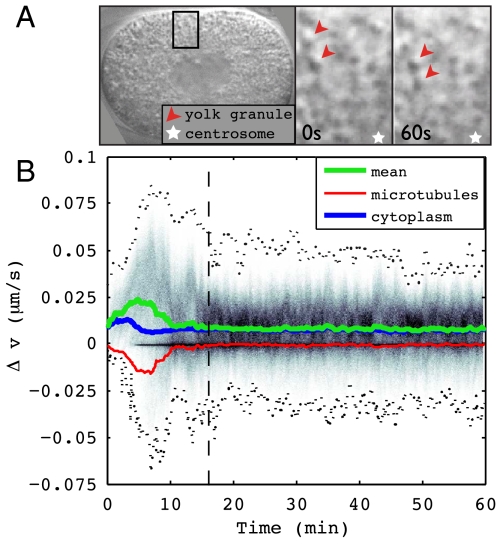
Fig. 4.
(A) Differential interference contrast imaging of a live embryo shows linear motion of yolk granules along the lengths of MT filaments toward the centrosome (Movie S2). (B) The background density shows the distribution of motor protein velocities along the lengths of MTs throughout the simulation of the WT case, with its mean (green) and boundaries (dotted lines). The mean MT velocity (red) and cytoplasm velocity (blue) along MTs, directed toward minus ends, are also shown.

