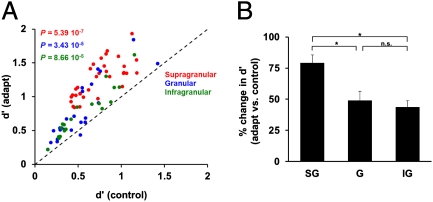
Fig. 5.
Postadaptation layer-specific changes in neuronal discrimination performance. (A) Scatter plot showing the effects of adaptation on neuronal discrimination performance (d′) at the population level across cortical layers. Each dot represents the mean d′ during control and adaptation, whereas the different colors indicate the layer in which the neuron was isolated. Across the total population of cells (SG = 33; G = 24; IG = 20), adaptation significantly increases orientation discriminability. (B) Although adaptation significantly increases d′ across all cortical layers, the largest increase occurred in the supragranular layer.

