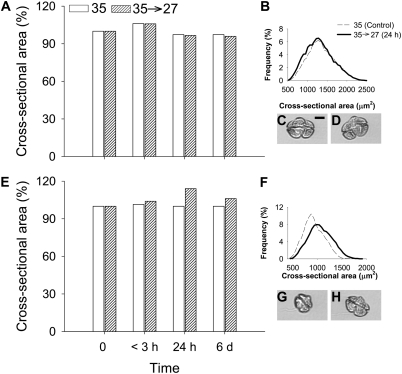
Fig. 3.
Time course of changes in CSA for K. brevis after hypoosmotic stress. (A) Percent increase in CSA for K. brevis Wilson clone from the control cultures at <3 h, 24 h, and 6 d after hypoosmotic stress. (B) CSA frequency for the Wilson clone before hypoosmotic stress and 24 h after hypoosmotic stress (control, n = 11,351; <3h, n = 15,825; 24 h, n = 20,856; 6 d, n = 29,107). (C) K. brevis Wilson clone cell before hypoosmotic stress. (D) K. brevis Wilson clone cell 24 h after hypoosmotic stress. (E) Percent increase in CSA for K. brevis SP1 clone, as in A. For the low brevetoxin-producing clone SP1, the increase in CSA after hypoosmotic stress was larger than daily variation in control culture. (F) Increase in CSA frequency for SP1 before hypoosmotic stress and 24 h after hypoosmotic stress (control, n = 22,296; <3h, n = 27,692; 24 h, n = 18,061; 6 d, n = 9,934). (G) K. brevis SP1 clone cell before hypoosmotic stress. (H) K. brevis SP1 clone cell 24 h after hypoosmotic stress. (Scale bar: 10 μm.)

