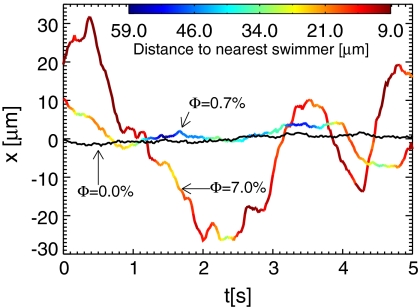
Fig. 2.
Trajectories of sample tracer particles along one axis over 5 s, as a result of random, advective displacements by nearby swimming cells for three different volume fractions Φ. The amplitude of the position fluctuations becomes larger with increasing swimmer concentration. The color of the trajectory represents the particle’s distance from the nearest swimmer for Φ = 7.0% and 0.7%. The black curve corresponds to Φ = 0.0%, measured in the absence of swimmers where only Brownian motion is acting.

