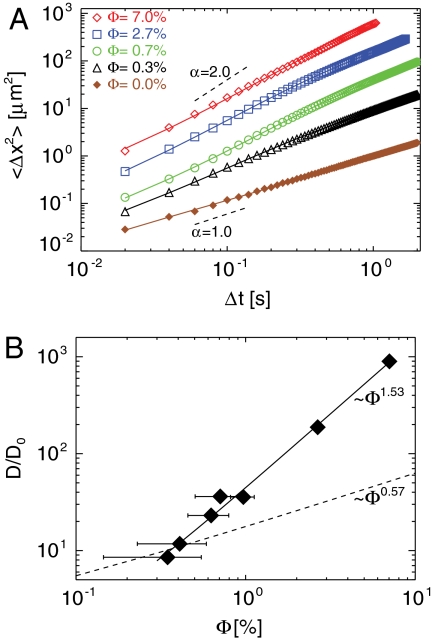
Fig. 5.
(A) Mean square tracer displacements for various swimmer volume fractions Φ, where the solid lines are the Langevin functional fits to Eq. 1. Two dashed lines are drawn to show the slopes α = 1.0 and α = 2.0. (B) The effective diffusion coefficient D, normalized by the measured Brownian diffusivity D0, is shown as a function of Φ. The horizontal error bars represent the uncertainty in Φ; the vertical error bars are too small to be seen. The solid line represents a power-law fit D ∼ Φ1.53, and the dashed line D ∼ Φ0.57 is the diffusivity scaling in the dilute limit, estimated in the section on conditional sampling. The rapid growth of D with Φ is evident.

