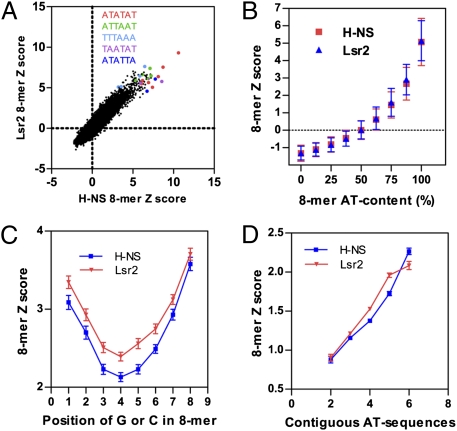
Fig. 1.
H-NS and Lsr2 exhibit similar DNA binding specificity and bind contiguous AT sequences. (A) Scatter plots comparing DNA binding of Lsr2 and H-NS; the Z-score of individual 8-mers were plotted. The Z-score was calculated from the average signal intensity across the 16 or 32 spots containing each 8-mer. Examples of 8-mers containing the indicated 6-mer sequences are highlighted. (B) The Z-score of individual 8-mers were plotted against the AT-content of each 8-mers, showing binding preference of H-NS and Lsr2 for AT-rich sequences. A total of 32,896 DNA sequences were used for calculation for each protein and the results are mean ± SD. (C) The Z-score (mean ± SD) of individual 8-mers that are 87.5% AT was plotted against the position of G or C. (D) The Z-score (mean ± SEM) of individual 8-mers containing 75% AT was plotted against the number of contiguous AT sequences.

