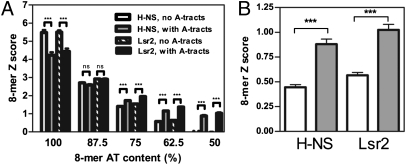
Fig. 2.
Effects of A-tracts on H-NS and Lsr2 binding to DNA. (A) The Z-score (mean ± SEM) of individual 8-mers were plotted for each AT-content, and the 8-mers that contains an A-tract DNA were compared with 8-mers that do not contain A-tracts but have the same AT-content. (B) The Z-score (mean ± SEM) of individual 8-mers containing 50% AT was plotted, and 8-mers containing A-tract DNA (AAAA, AAAT, AATT, ATTT, TTTT, filled bar) were compared with 8-mers that contain contiguous AT sequences (ATAA, ATAT, ATTA, AATA, TAAA, TAAT, TATA, TATT, TTAA, TTAT, TTTA, empty bar) but not A-tracts (they contain the T-A step). ***P < 0.0001; ns, not significant.

