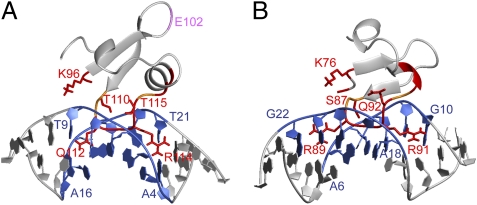
Fig. 4.
Structure models of H-NSCtd/DNA and Bv3FCtd/DNA complexes. Ribbon representation of H-NSCtd/DNA (A) and Bv3FCtd/DNA (B) docking models. Protein backbone and side chains that are involved in DNA-binding are labeled in red. Residues without NH signals but may be involved in DNA-binding are labeled in orange. The binding interface of DNA is shown in blue. Residue E102 of H-NS that showed chemical-shift changes but is not involved in DNA binding is labeled in purple (A).

