Fig. 2.
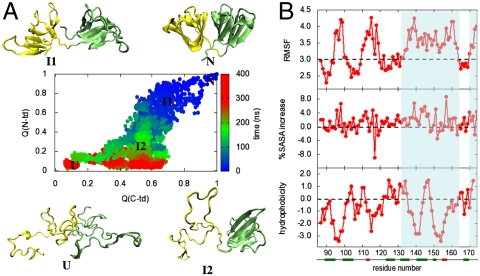
(A) Simulated unfolding of human γD-crystallin at 425 K in 8 M aqueous urea. The fraction of native contacts formed, Q(?), for the two domains are plotted against each other, as obtained from an aggregate of approximately 2 μs of unfolding simulations. Each point on this plot is colored from blue to red according to its time sequence during unfolding. Typical conformations populated at different stages of unfolding are also shown. (B) Structural changes of the C-td in the I2 ensemble. The RMSF in Å from the native structure, the percentage of solvent-exposed surface area (%SASA) change, and the Kyte–Doolittle hydrophobicity are plotted for each residue of the C-td within the I2 ensemble consisting > 1,000 conformations with QC-td≥0.4 and QN-td ≤ 0.3. The regions that undergo strong conformational fluctuation and/or solvent exposure, as well as contain hydrophobic residues, are highlighted.

