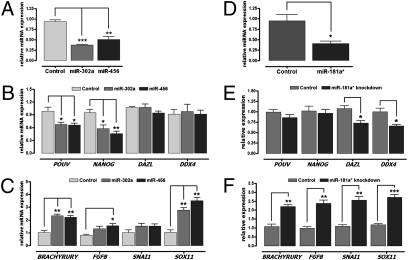
Fig. 3.
Quantitative expression analysis after knockdown of miR-302a and miR-456 in undifferentiated blastoderm cells and after knockdown of miR-181a* in chicken PGCs. (A) Relative miRNA expression in stage X blastoderm cells following silencing with the knockdown probes for miR-302a or miR-456. (B) Relative expression of pluripotent genes (POUV and NANOG) and germ cell-related genes (DAZL and DDX4) in stage X blastoderm cells after transfection of the knockdown probe for miR-302a or miR-456. (C) Relative expression of somatic genes (BRACHYRURY, FGF8, SNAI1, and SOX11) in stage X blastoderm cells following transfection of the miR-302a or miR-456 knockdown probes. (D) Relative miRNA expression in PGCs after miR-181a* silencing. (E) Relative expression of pluripotent genes and germ cell-related genes in PGCs after miR-181a* knockdown. (F) Relative expression of somatic genes in PGCs after miR-181a* silencing. Noncomplementary sequences in the chicken genome were used as a control. real-time PCR was conducted in triplicate and normalized to control expression of snoRNA (A and D) or GAPDH (B, C, E, and F). Significant differences between control and treatment groups are indicated as ***P < 0.001, **P < 0.01, and *P < 0.05. Error bars indicate the SE of triplicate analyses.

