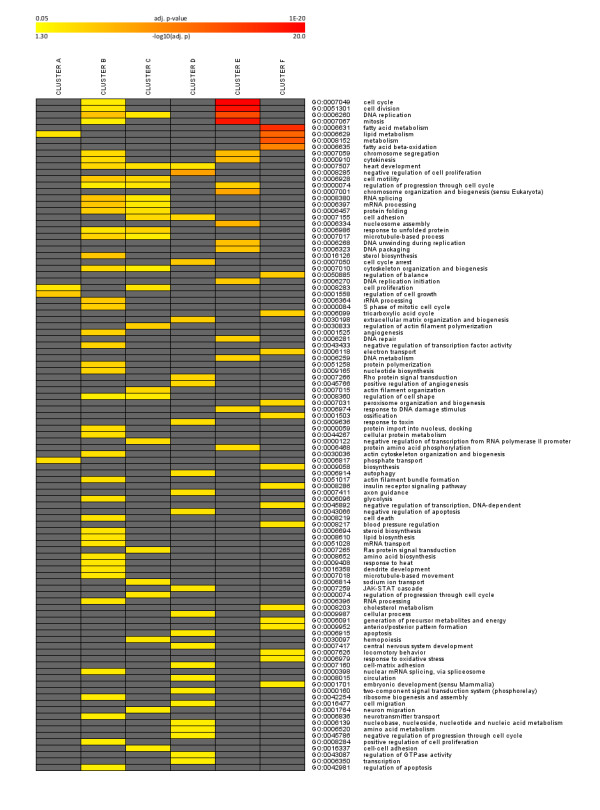
Figure 2.

Gene ontology analysis. Heatmap for overrepresented gene ontology terms for genes in 6 clusters over several time points during adipocyte differentiation in 3T3-L1 and MEF cells as visualized in Figure 1 (color coding according to legend at the top, only gene ontology terms with adjusted p < 0.05 were considered) is shown.
