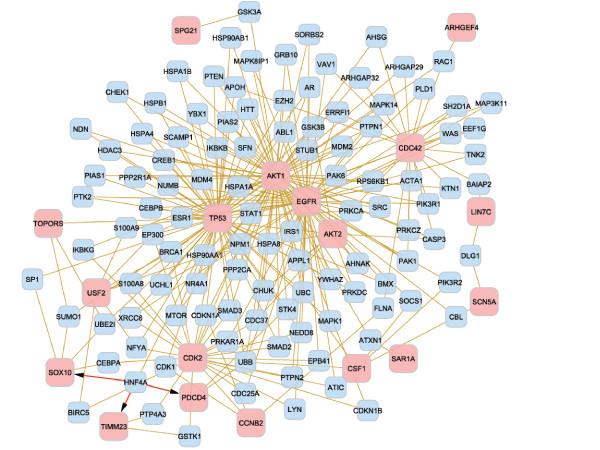
Figure 4.
Gene network from the functional analysis of lifetime glioblastoma survival. Interaction between the significant genes from the functional analysis of lifetime glioblastoma death. The gold edges represent protein interactions whereas the red edges represent interaction of the HNF4A protein with the DNA of the genes Pdcd4, Sox10 and Timm23. Of the 24 genes from Table 9, 18 (pink nodes) interact among each other in a direct way or through an intermediate gene (blue nodes).

