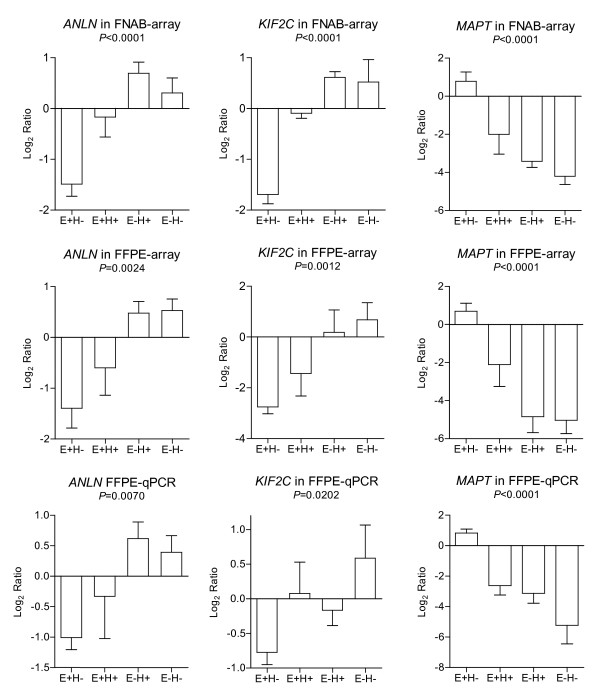
Figure 4.
Differential expression of the biomarkers. The histograms show the comparison of the average expression values of the three prognostic genes ANLN, KIF2C and MAPT from left to right respectively, which were shown to be significantly different among the four ER/Her2 clinical status groups [ER+/Her2- (E+H-), ER+/Her2+ (E+H+), ER-/Her2+ (E-H+), and ER-/Her2- (E-H-)], but reproducible among the microarray data from FNAB (FNAB-array) and FFPE samples (FFPE-array) of the 25 paired breast cancers, and RT-qPCR expression in FFPE samples (FFPE-qPCR) of the 22 available breast cancers. The P values were calculated by ANOVA test.

