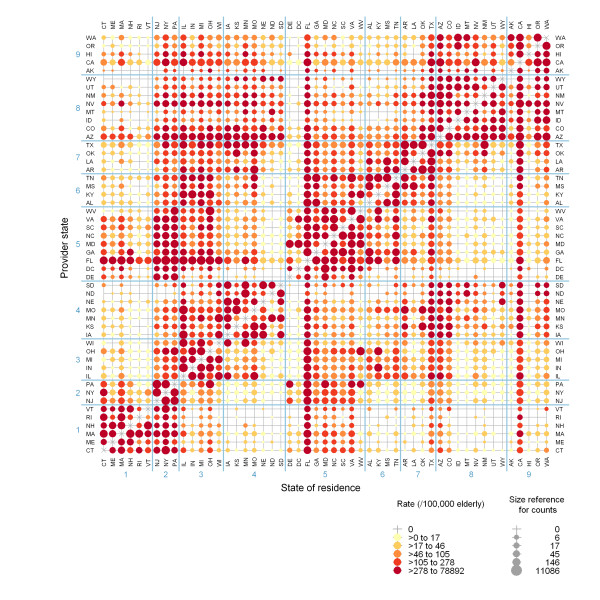
Figure 1.
Relative numbers and rates of pneumonia and influenza hospitalizations classified by state of residence and provider state, October-March. The different hues represent rates and the sizes represent counts. Hospitalizations with same residential and provider codes (i.e. the diagonal line) were not visualized due to their big sizes. States are ordered by the nine Census divisions--1: New England; 2: Middle Atlantic; 3: East north Central; 4: West North Central; 5: South Atlantic; 6: East South Central; 7: West South Central; 8: Mountain; 9: Pacific.

