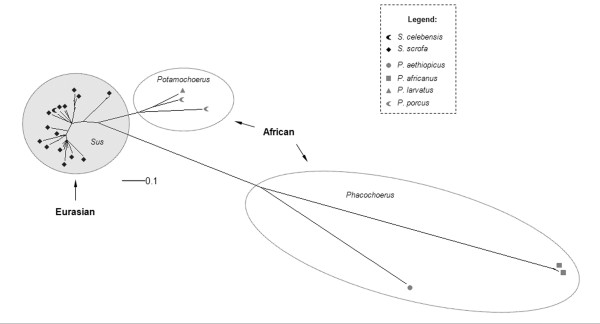
Figure 3.
Unrooted Bayesian inference for env class A gene. For clarity, posterior probability values are not represented, but all main groups showed a value of 0.99 to 1.00. Black symbols represent ERVs from the different Eurasian species and gray symbols represent ERVs from different African species (see legend for detail in coding).

