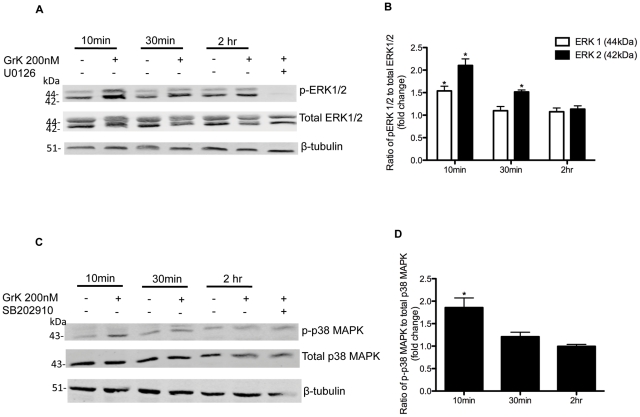
Figure 5. Western blot analysis of effect of GrK on ERK1/2 and p38 MAPK phosphorylation.
Cells were incubated with GrK (200 nM) for 10 min, 30 min, or 2 h. Cell lysates were collected and screened for (A) ERK1/2 phosphorylation using anti-phospho-ERK1/2 and anti-total-ERK1/2 antibodies and (C) p38 MAPK phosphorylation using anti-phospho-p38MAPK and total p38MAPK antibodies. Cells incubated with ERK1/2 inhibitor (U0126; 10 µM) or p38MAPK inhibitor (SB202190; 10 µM) prior to treatment with GrK (200 nM) for 10 min are included to demonstrate the activity of each inhibitor. Densitometry analysis of immunoblots was carried out using Li-COR Odyssey Infrared imaging system (Li-COR biosciences). (B) Relative levels of ERK1/2 phosphorylation (ERK1 white bars; ERK2 black bars) are expressed as a ratio of phospho-ERK1/2 to total ERK1/2. (D) Relative levels of p38 MAPK phosphorylation are expressed as a ratio of phospho-p38 MAPK to total p38 MAPK. Protein loading was normalized using β-tubulin. The values shown are mean +/− SEM from three separate experiments. * p<0.05 compared to media alone.

