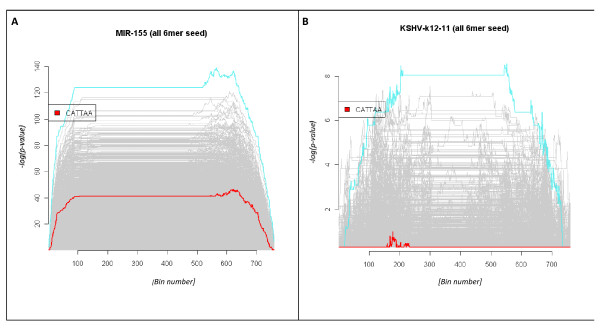
Figure 7.
Comparing miRNA orthologues. Composite plots summarising the enrichment scoring of all possible hexameric queries given the respective hsa-miR-155 (Panel A) and KSHV-miR-k12-11 (Panel B) differential expression profiles. In each instance the highest scoring hexamer is highlighted in turquoise while the highest scoring seed hexamer is highlighted in red. Note how the hsa-miR-155 profile is dominated by AT-rich transcripts and that there is minimal enrichment of the miRNA target motif. The paucity of significant motifs in the KSHV-miR-k12-11 plot highlight that few transcripts are differentially expressed relative to the control dataset. Also note that the seed region is conserved in both miRNAs.

