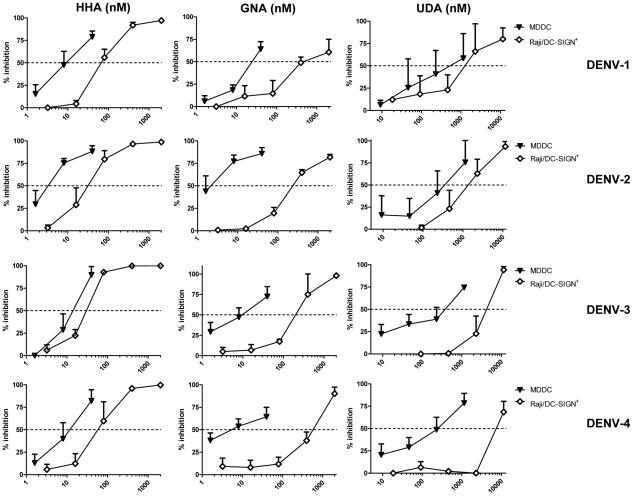
Figure 3. Antiviral activity of HHA, GNA and UDA in MDDC and in Raji/DC-SIGN+ cells.
MDDC (▾) or Raji/DC-SIGN+ cells (□) were infected with DENV-1, DENV-2, DENV-3 or DENV-4. Cells were incubated with increasing concentrations of HHA, GNA, UDA and viral infectivity was quantified by flow cytometry using 5 µg/ml anti-DENV mAb (clone 2H2). Data represent the percentage of inhibition of viral replication relative to the positive control (DENV-infected cells). Each value represents the mean ± SEM of 3 to 8 independent experiments.

