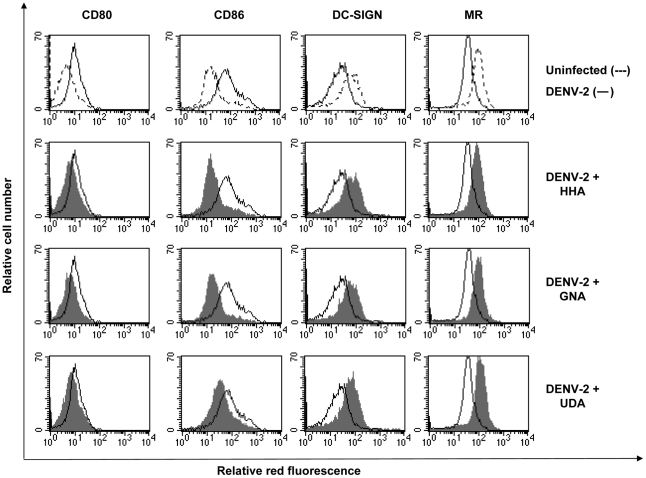
Figure 5. Differentiation process of MDDC induced by DENV-2 and inhibition of this process by CBAs.
MDDC were infected with DENV-2 in the absence or presence of 400 nM HHA, GNA or 2.3 µM UDA. 5 days post infection, cell surface expression of CD80, CD86, DC-SIGN and MR were analyzed by flow cytometry with specific PE-labeled mAbs. Shown is the surface expression of the marker in uninfected cell culture (dashed line), untreated DENV-2-infected cell culture (full line) and the CBA-treated DENV-2-infected cell culture (full histogram). Data shown here are from 1 representative donor out of 4 different blood donors.

