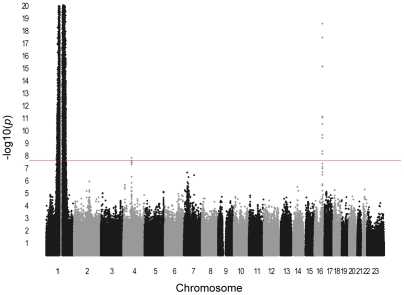
Figure 2. Manhattan plot of meta-analysis P-values in GWAS for total WBC count.
Horizontal axis indicates chromosomal position. Vertical axis indicates −log10 P-values from inverse variance-weighted fixed effects meta-analysis. The red horizontal line indicates the genome-wide significance threshold of P = 2.5×10⁻⁸. Association signals are present at 1q23, 4q13, and 16q22. The P-values for the broad chromosome 1 signal are truncated at 10−20. This region spans nearly 90 Mb on both arms of chromosome 1 and results artifactually in two apparently distinct peaks because of the lack of genotyped or imputed SNPs around the centromere.

