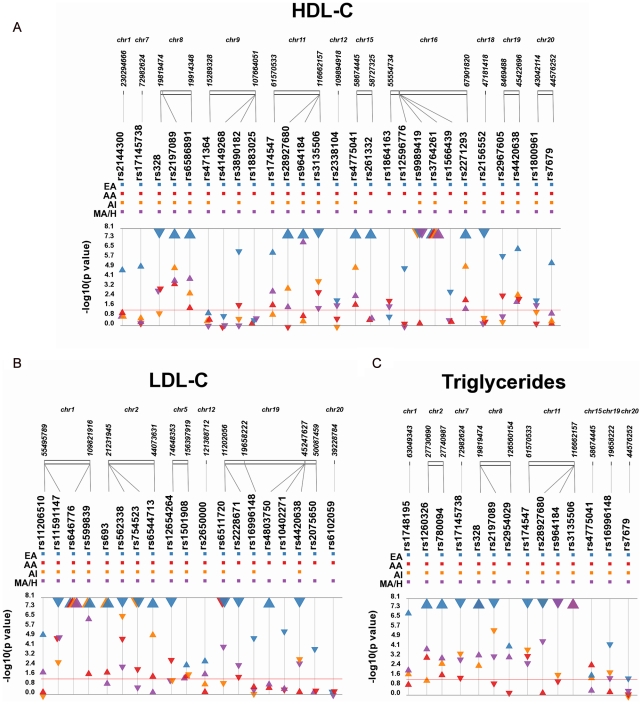
Figure 1. Meta-analysis results for GWAS–identified SNPs by population.
Each SNP was tested for an association with the indicated trait assuming an additive genetic model adjusted for age and sex. Meta-analysis was performed, and p-values (−log10 transformed) of the meta-analysis are plotted along the y-axis using Synthesis-View [73], [74]. SNP location is given on the x-axis. Each triangle represents a meta-analysis p-value for each population. Populations are color-coded as follows: European Americans (blue; EA), African Americans (red; AA), Mexican Americans/Hispanics (orange; MA/H), and American Indians (purple; AI). Large triangles represent p-values at or smaller than genome-wide significance (p<10−8). The direction of the arrows corresponds to the direction of the beta coefficient. The significance threshold is indicated by the red bar at p = 0.05.

