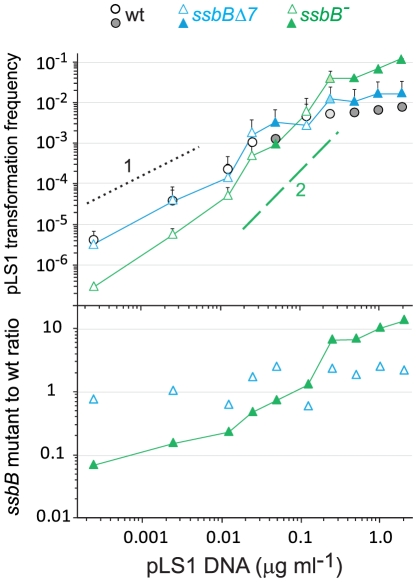
Figure 5. SsbB antagonizes plasmid transformation at high DNA concentration.
Top panel: competent cells (∼1.1 108 cfu ml−1) of strain R1818 (ssbB +), R2647 (ssbBΔ7) and R2646 (ssbB −) were exposed to pLS1 plasmid DNA. TcR transformants were scored. Data are from five independent experiments with two different pLS1 DNA preparations (I and II, distinguished by open and color-filled symbols, respectively); transformation frequencies with 0.25 µg ml−1 DNA correspond to average of data obtained with the two preparations (light-coloured symbols). For clarity, only half error bars are figured. Dotted and dashed lines indicate, respectively, slope of 1 and 2 (i.e. linear and quadratic dependence on DNA concentration). Bottom panel: ratio of plasmid transformants between ssbB mutant and wildtype cells calculated from data in top panel.

