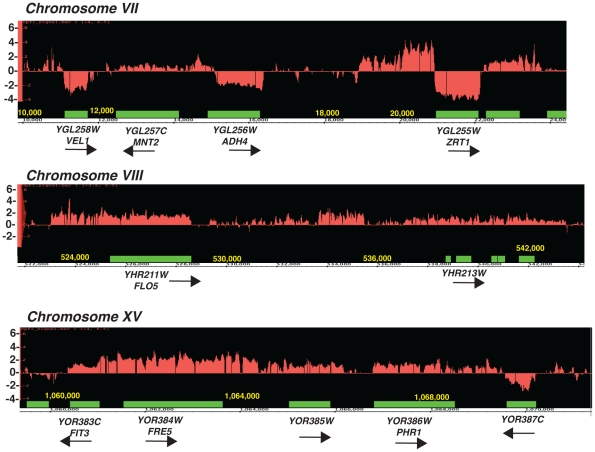
Figure 1. Tiling arrays profiles of the upf1Δ mutant relative to the wild-type strain.
Green boxes represent the boundaries of open-reading frames, red the log2 ratio of the RNA signals detected in the upf1 Δ mutant relative to wild-type. Arrows indicate the direction of transcription of the ORFs. Shown are three segments of three chromosomes.

