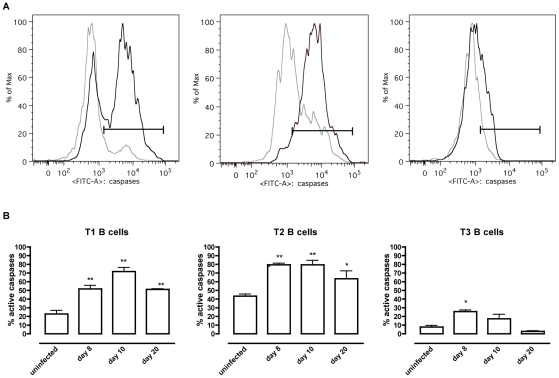
Figure 4. T. brucei infection-induced apoptosis of transitional B cells.
Spleens cells from uninfected control mice and mice infected with T. brucei were stained for surface markers commonly used to define transitional T1, T2 and T3 B cells (as described in table 1) and the amount of active caspases −1, −3, −4, −5, −6, −7, −8 and −9 was measured by intracellular staining using the FAM poly caspases assay kit and flowcytometry. (A) Representative histogram of uninfected controls (grey line) versus a day 10 p.i. (black line). (B) Percentage of apoptotic cells within T1, T2 and T3 transitional B cell populations in uninfected controls versus infected mice on day 8, 10 and 20 p.i. Data are represented as mean of three mice per group ± SEM and two independent repeat experiments were performed (*) p<0,05, (**) p<0,01.

