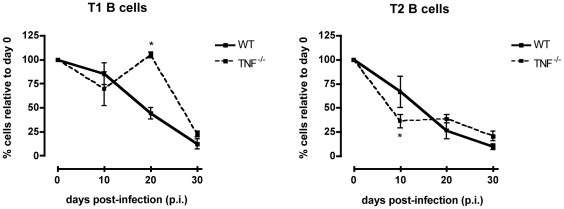
Figure 6. Transitional T1 and T2 B cells in T. brucei-infected C57Bl/6 WT versus TNF−/− mice.
Percentage of total transitional T1 (left) and T2 (right) B cells in the spleen of uninfected controls (100%) versus T. brucei-infected C57BL/6 WT and TNF−/− mice on day 10, 20 and 30 p.i. Data are represented as mean of three mice per group ± SEM and three independent repeat experiments were performed.

