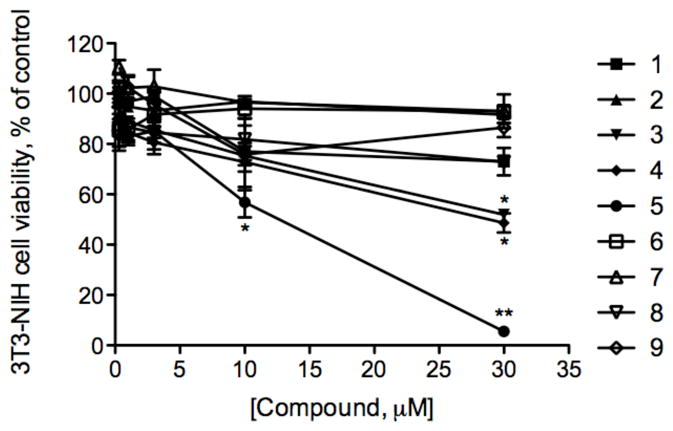
Figure 3. Cell survival curves as measured by MTT assay for 1–9 against the murine fibroblast cell line NIH-3T3.

Cells were incubated with various concentrations of brassinosteroids (0.3–30 μM) for 24 h at 37 °C. The mean absorbance of the control cells represented 100% cell proliferation, and the mean absorbance of treated cells was related to control values to determine sensitivity. Error bars represent standard error (n=6) from mean cell proliferation as determined by repeated experiments.
