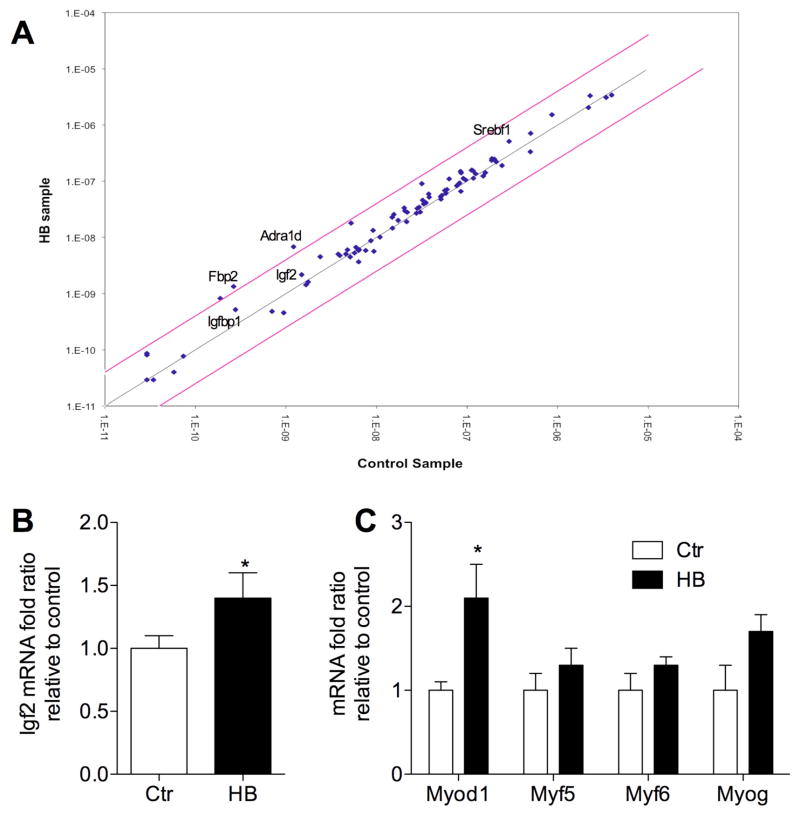
Figure 5. Pharmacogenomic effect of HB in vivo.
(A) RNA was extracted from pooled (n=5) gastrocnemius muscle samples of control and HB-treated animals (60 mg/kg for 24 d) and analyzed using rat insulin signaling pathway PCR array to measure relative gene expression levels for 84 genes. Central black line indicates fold changes ((2^(-ΔCt)) of 1, while the pink lines indicate the 4 fold-change in gene expression threshold. (B) Results for Igf2 gene expression and (C) a set of the myogenic transcriptional factors that modulate muscle growth and differentiation were further confirmed by conventional RT-PCR on individual muscle samples (n=5) from control and HD-treated animals. Results are expressed as the mean ± SEM of determinations performed in duplicate (* P<0.05 when compared with control by Student t test).

