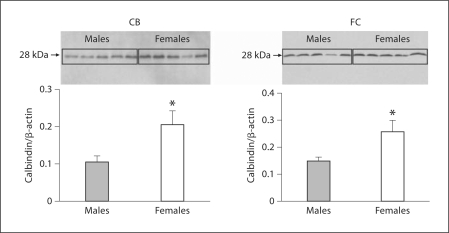
Fig. 2.
Protein quantification of calbindin reveals sex differences in the cortex and CB. Calbindin protein quantification in CB and FC by Western blots. Each lane represents an individual animal. The ratio of calbindin to β-actin for each sample was measured (n = 5; animals were analyzed for each sex and region). Histograms represent the mean + SEM of the calbindin/β-actin ratio designating the protein level. * Females expressed significantly more calbindin protein (p < 0.05) than did males in both the CB and the FC.

