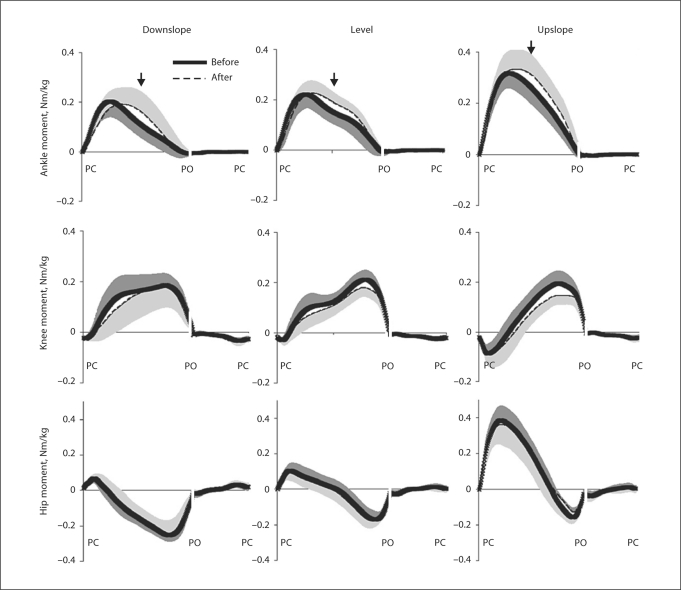
Fig. 5.
Mean moments of force at 3 hindlimb joints during downslope, level and upslope walking before (thick continuous line) and 1–3 weeks after (dashed line) denervation of SO and LG muscles. Positive values correspond to extensor moments. Moments were normalized by mass of the cat. SD values are shown for one direction to avoid clutter. The arrows indicate time instances of the maximum difference between the pre- and postdenervation moments for the ankle joint (table 3). PC = Paw contact; PO = paw off. Stance and swing times were normalized separately which is indicated by interruption of the time axis (see stance and swing times in table 1). Mean data of 5 cats.

