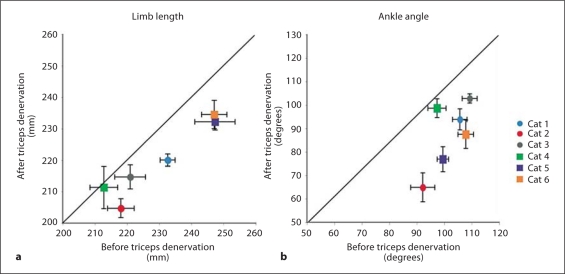
Fig. 3.
The mean minimum limb length (a) and ankle angle (b) during weight acceptance plotted before versus after the denervation of the triceps surae. Note that in all but 1 case limb length decreased and in all cases ankle flexion decreased after denervation. Solid line = Line of identity; circles = experiments in which denervation was performed first; squares = experiments in which fasciotomy was performed first.

