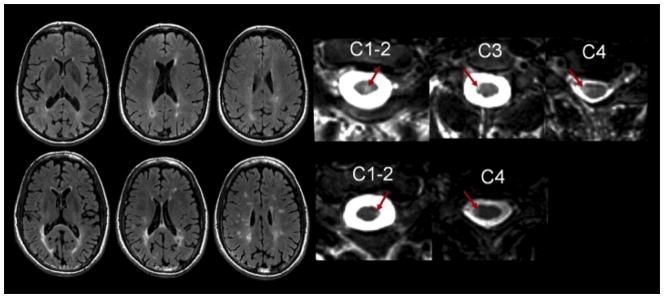
Figure 1.
MRI from two patients showing representative FLAIR brain and T2-weighted spinal cord images illustrating the unreliable correlation between brain and cord involvement. The top row is a 44 year-old woman with a history of relapsing-remitting MS with an EDSS score of 3. The patient had a relatively low total brain lesion volume (4015.2 mm3) and high total spinal cord lesion volume (558.9 mm3). The bottom row is 46 year-old man with a history of relapsing-remitting MS with an EDSS score of 0. The patient had a relatively high total brain lesion volume (26995.0 mm3) but low total spinal cord lesion load volume (134.8 mm3). Arrows represent spinal cord MS lesions.

