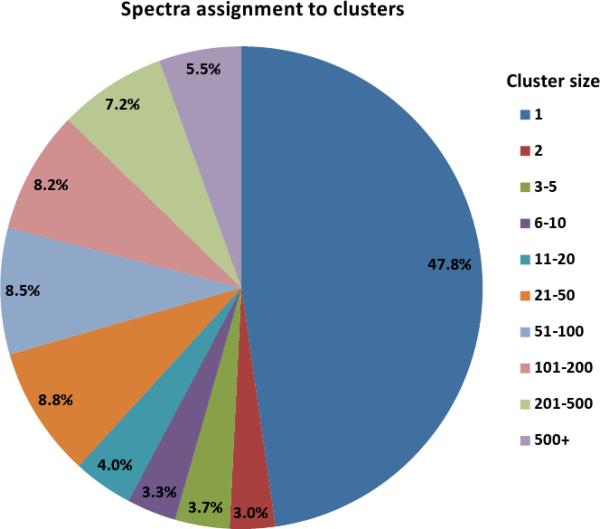
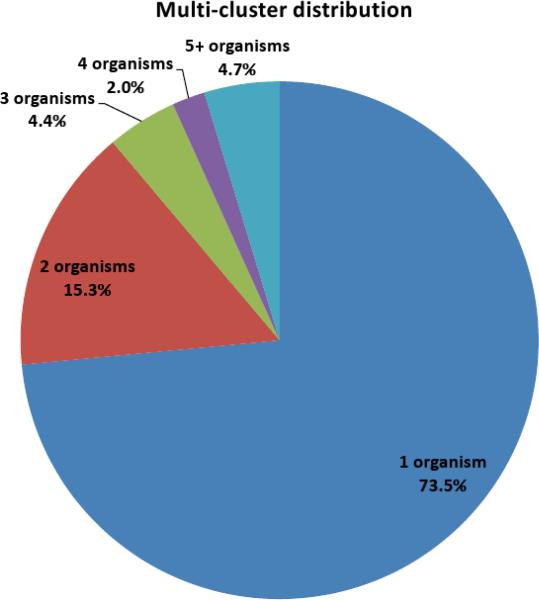
Figure 1.
Clustering of the PNNL dataset. 581 million spectra from the PNNL dataset that passed quality filtration were assigned into 299 million clusters of different sizes. (a) While most spectra form multi-clusters (i.e., clusters containing at least two spectra), most clusters consist of a single spectrum. (b) A breakdown of the clusters according to the number of organisms whose spectra participated in each cluster for each of 21.5 million multi-clusters.


