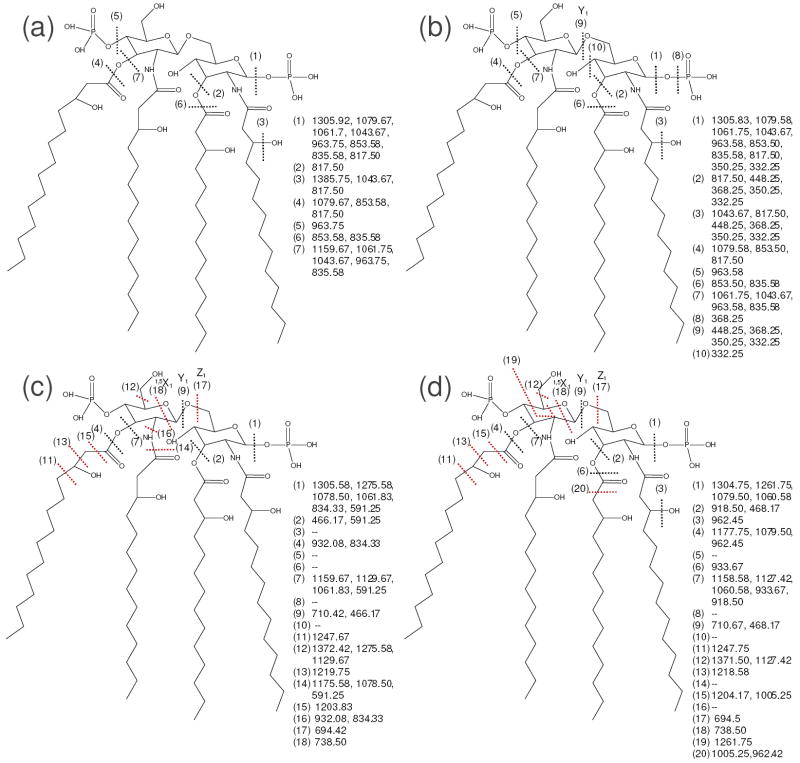
Figure 2.
Fragmentation behavior of lipid IVA by (a) CID, 1-, (b) IRMPD, 1-, (c) 193 nm UVPD, 1-, and (d) a-EPD, 1-•. Dashed lines represent cleavage sites, and are matched with the m/z values to the right of the structure, which were taken from the representative mass spectrum (Figure 1). Key cleavages seen for UVPD and a-EPD that were not observed for CID or IRMPD are marked with red lines.

