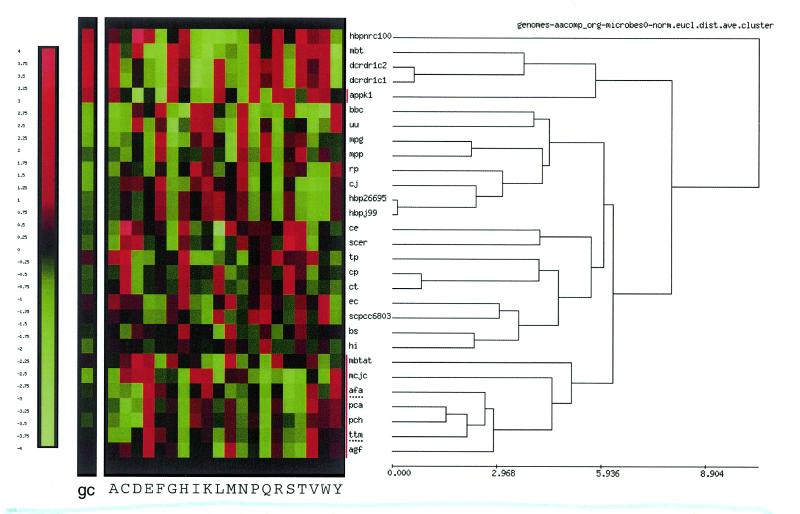
Figure 1.
Standardised amino acid composition data of completely sequenced organisms grouped by hierarchical clustering. The GC ratios are shown for reference but were not used for the clustering process. Amino acids are abbreviated by the standard one letter code. The labels indicating the data sets for each row are explained in Table 1. In this figure, labels for thermophiles are marked with a red vertical bar, the thermophilic bacteria are highlighted by a dotted underline. The coloured blocks show normalised values as seen from the colour bar at the left. Red and green mean more and less than average, respectively. The scale for the dendrogram represents Eucledian distance. See Materials and Methods for details.

