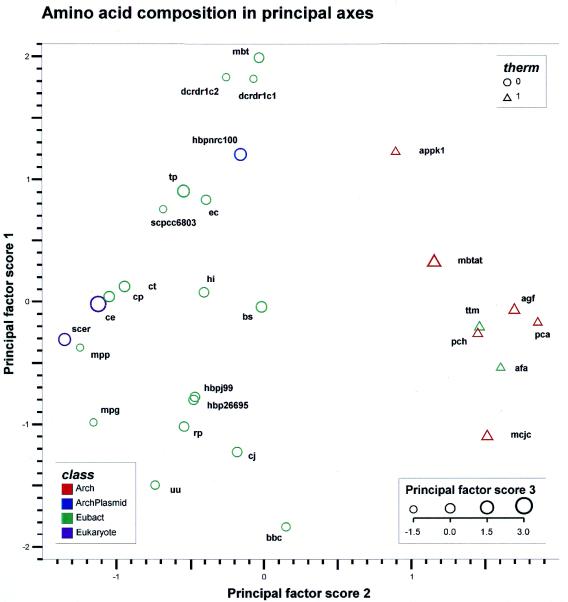
Figure 2.
Reduced dimensionality plot showing the main principal components of the global amino acid compositions. The first principal axis (vertical) corresponds to GC ratio (see text). The second principal axis (horizontal) shows a clear separation of thermophiles and mesophiles, denoted by triangles and circles, respectively. The third principal component is depicted by symbol size (see insert for scale). Colour groups the sources into archea (red), bacteria (green) and eukaryotes (purple). The plasmid (the outgroup for hierarchical clustering, Fig. 1) is shown in blue. The graph is a projection, and distances are therefore not directly comparable to the distances observed in Figure 1. See text for discussion. For an explanation of data set labels see Table 1.

