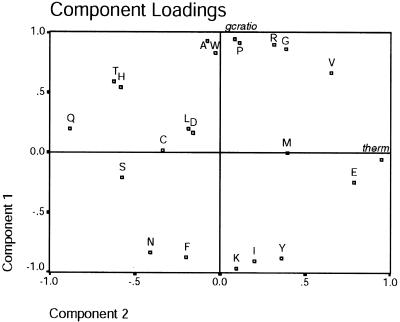
Figure 3.
Component loadings for the main principal components. Component loadings can be interpreted as correlation coefficients (10). This plot shows to what degree the original variables contribute to the principal components. The figure further displays the correlations to the observed GC ratio and therm, the binary variable indicating thermophily (see Materials and Methods). These are shown for reference but have not been used as PCA input. Component loadings with an absolute value of ≥0.6 are commonly considered as high.

